The online database that provides 3 databases in 1
Our products
What is price allocation data?
PPAnalyser is an online database that covers the following 3 databases:
PPAnalyser is an online database that provides 3 databases in 1.
The 3 databases cover:
– Publically available purchase price allocation data
– Economic useful lives
– Discount rates and impairment amounts
Our team of specialists is continously adding new data from various public sources.
PPAnalyser is an online database that provides 3 databases in 1. The 3 databases cover: (1) Publically available purchase price allocation data (2) Economic useful lives and (3) Discount rates
We retrieve our information from annual and quarterly reports and record relevant information details in a standardised way.
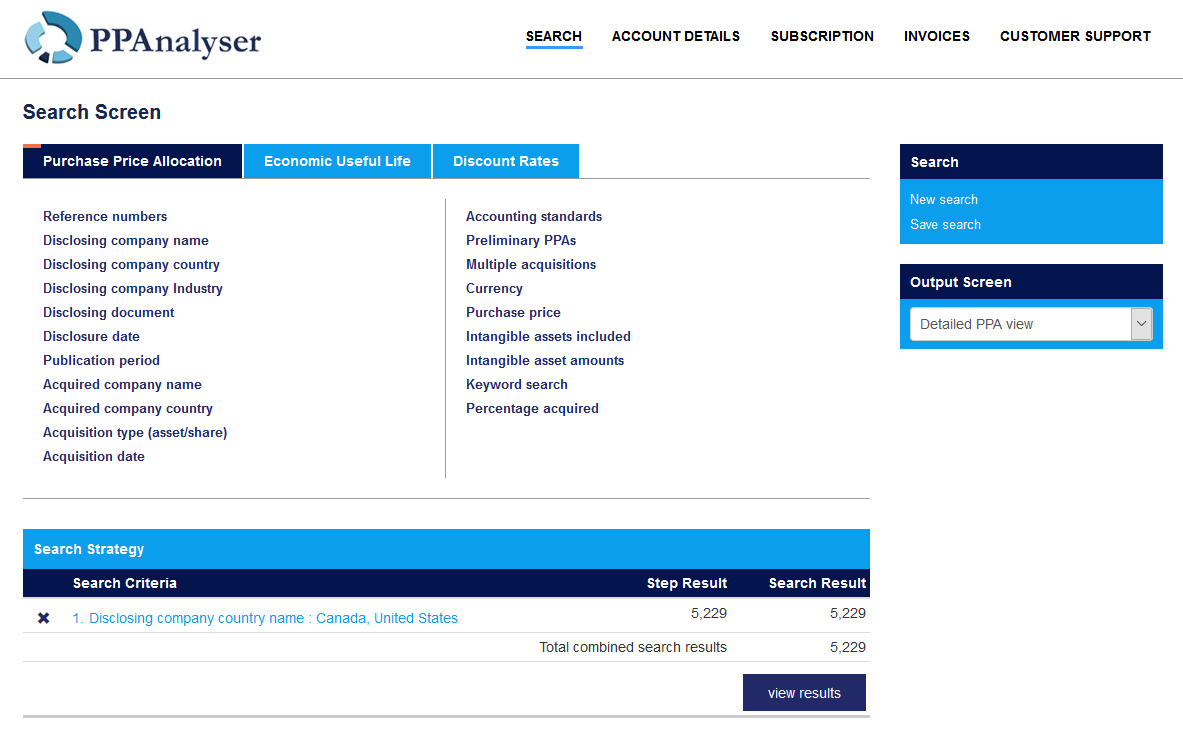
The PPAnalyser search engine enables users to search by a wide variety of fields including industry, period, disclosing company, keywords, intangible asset type or geographical region. Search results can be visualised in many ways. Data can be disclosed with full details, in a consolidated way or through excel exports. In addition, each records provides the original PDF that includes the original source file.
1. Purchase Price Allocation data
Business combinations have to be recorded in line with Accounting Standards ASC 805 (US GAAP) and IFRS 3 (IFRS) (hereafter referred to as “Standards”). After each acquisition, companies that comply with the Standards disclose the allocation of the purchase price of the acquisition in line with the Standards.
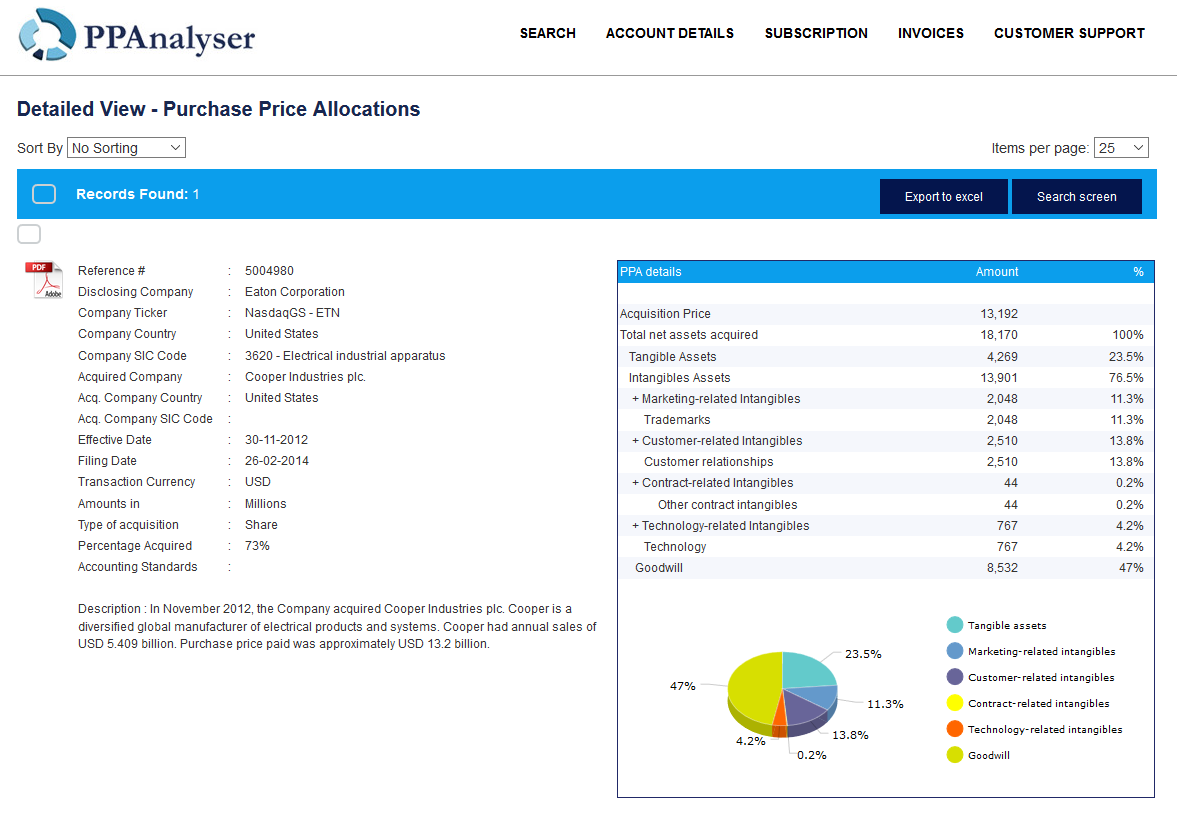
PPAnalyser records the publically disclosed purchase price allocations (hereafter “PPAs”) in a standardised way. As a result, PPAs can be easily found and analyses.
The purchase price allocation is segmented in 20 intangible asset categories that are grouped in the 6 intangibles groups. In addition goodwill is of recorded separately. Besides intangibles assets, various tangible assets and liabilities are recorded separately. The latter makes it possible to distinguish the purchase price from the total asset value in order to arrive at the allocation of the purchase price amount all assets acquired.
PPAs can be viewed is various forms. The most detailed output screen, displays all fields available for a single PPA. This view includes a pie chart that graphically illustrates the allocation among the assets. Also, this view includes the PDF with the source report where the PPA was disclosed. A consolidated view consolidates the PPAs identified through the search strategy and displays a consolidated allocation of assets. Also, here a pie chart is shown to illustrate the allocation. Finally an excel export makes it possible to export relevant fields.
2. Economic useful life data
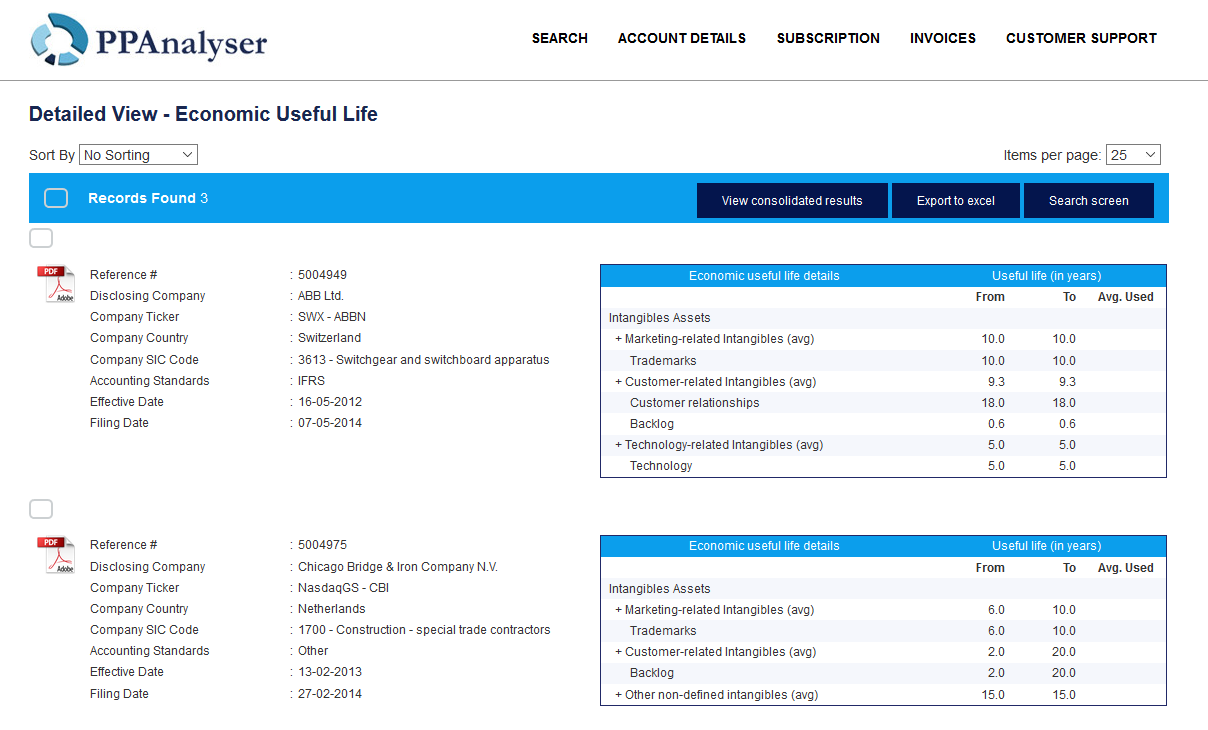
Companies often disclose economic useful lives of there intangibles assets as part of various financial reporting requirements. PPAnalyser records the economic useful lives in a standardised way and segments the data among 20 intangible asset categories. Where applicable the economic useful lives are shown as a range as many disclosures refer to a range rather than a fixed period. Also, where an average economic useful lives has been used, this information is store in the database.
There various output screens available. The most detailed output screen, displays all fields available for a single economic useful live. This view includes the PDF with the source report where the economic useful live was disclosed.
A consolidated view consolidates the economic useful lives identified through the search strategy performed and displays a consolidated interquartile range of economic useful lives per intangibles asset. The graphical illustration visualises the data is such a way that it is relatively easy to determine the economic useful live that is used most for a specific intangibles. Finally an excel export makes it possible to export relevant fields.
3. Discount rate data
Impairments and purchase price allocation typically required the use of discount rate assumptions. The discount rate is a key assumption in the valuation analysis and can significantly influence the outcome of the analysis.
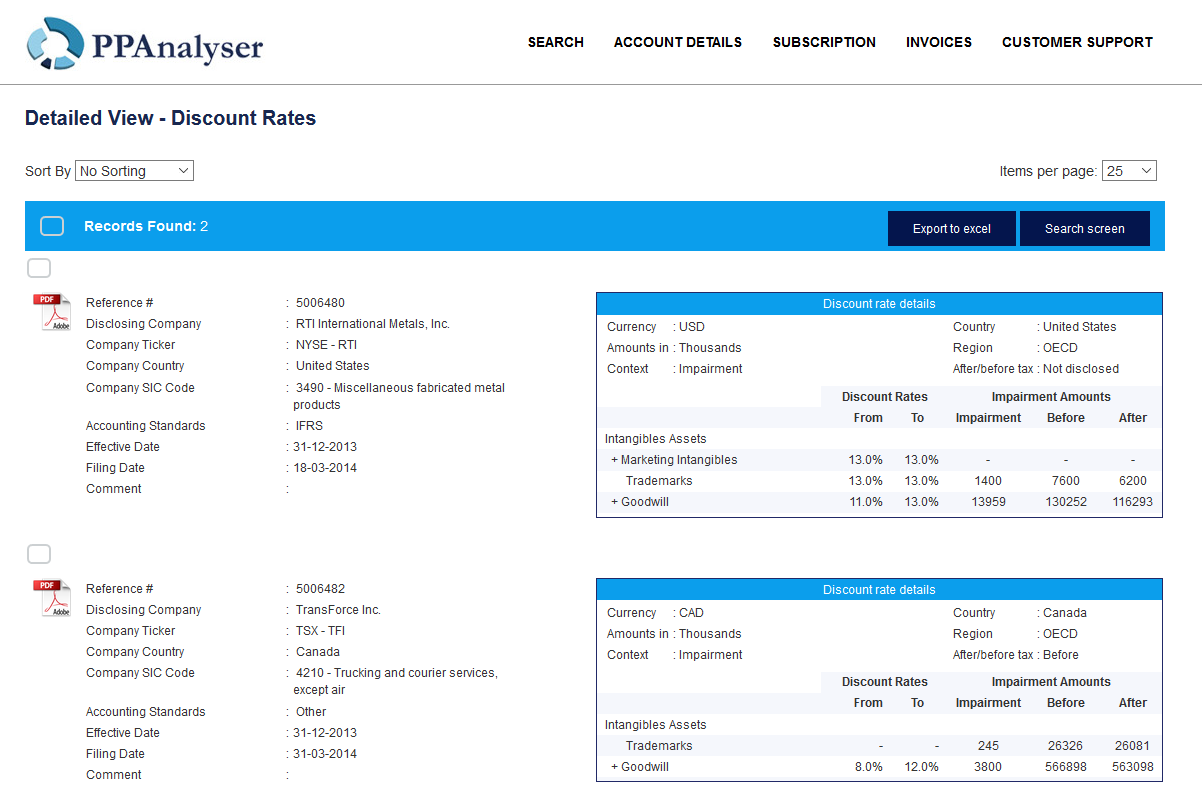
PPAnalyser records the discount rates used for the purpose of impairments and purchase price allocations. In addition PPAnalyser records the impairment amounts where disclosed. The discount rates and impairment amounts are segmented among 20 intangible asset catergories. The database also records whether the discount rates is used before tax or after tax (where disclosed).
Discount rates and impairment amounts can be viewed is various forms. The most detailed output screen, displays all fields available for a records. This view includes the PDF with the source report where the economic useful live was disclosed.
A consolidated view for discount rates consolidates the discount rates identified through the search strategy performed and displays an interquartile range of discount rates per intangibles asset category. The graphical illustration visualises the data is such a way that it is relatively easy to determine the discount rate that is used most for a specific intangibles. A consolidated view for impairments consolidates the impairment amounts identified through the search strategy performed and displays the total impairments per intangibles asset category. Finally an excel export makes it possible to export relevant fields.
